 |
|
|
|
| Model Performance | ||||||||||||||||||||||||
|
|
||||||||||||||||||||||||
|
||||||||||||||||||||||||
| Nearest Neighbors from Test Set |
 |
|
|
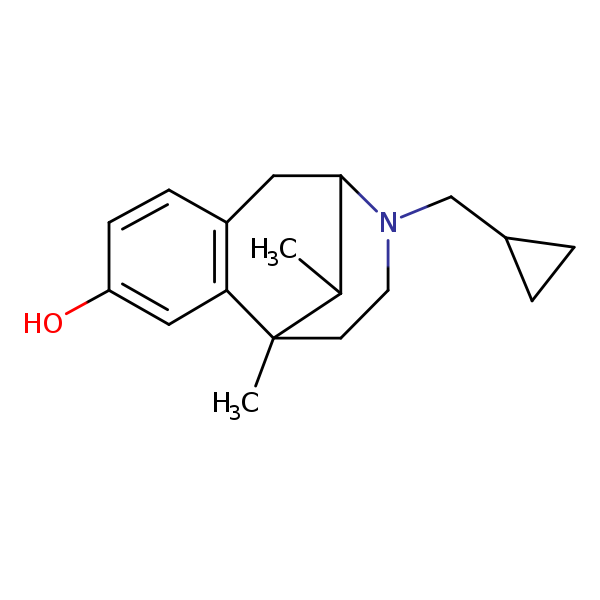
| Test chemical Measured: N/A Predicted: 2.37 Cyclazocine |
Similarity: 0.58 Measured: -0.398 Predicted: 1.15 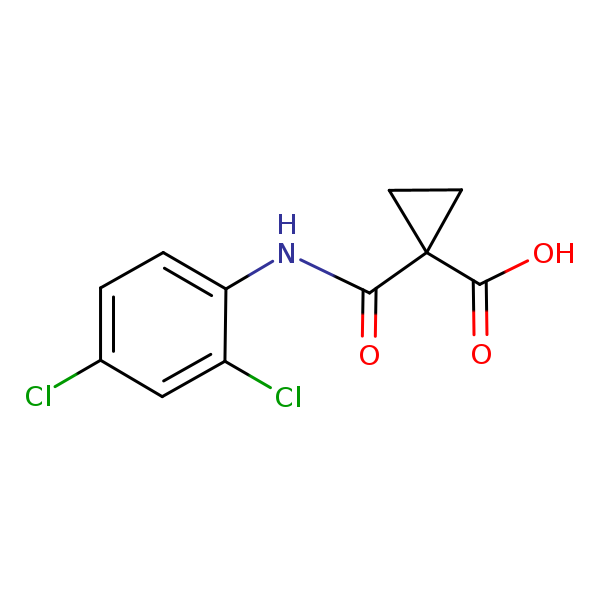 Cyclanilide |
Similarity: 0.58 Measured: 3.29 Predicted: 2.53 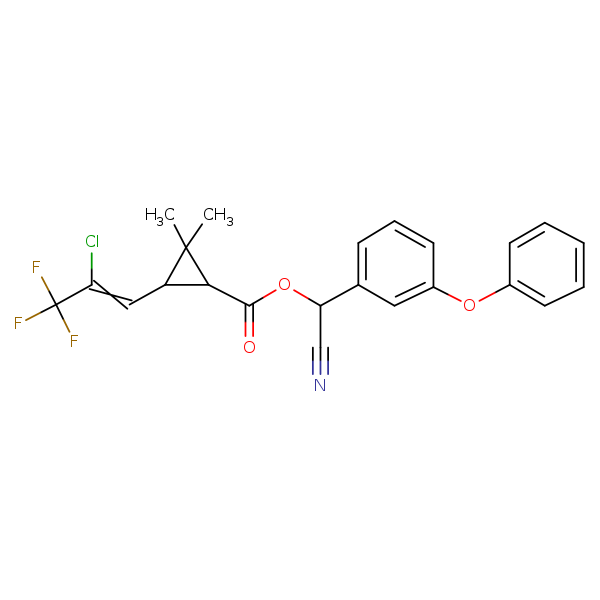 alpha-Cyhalothrin |
| Nearest Neighbors from Training Set |
 |
|
|
| Test chemical Measured: N/A Predicted: 2.37 Cyclazocine |
Similarity: 0.66 Measured: 2.59 Predicted: 1.61 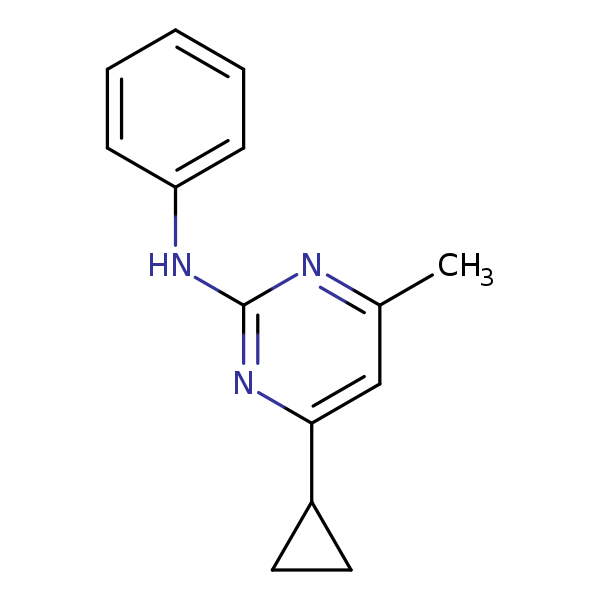 Cyprodinil |
Similarity: 0.60 Measured: 2.72 Predicted: 2.46 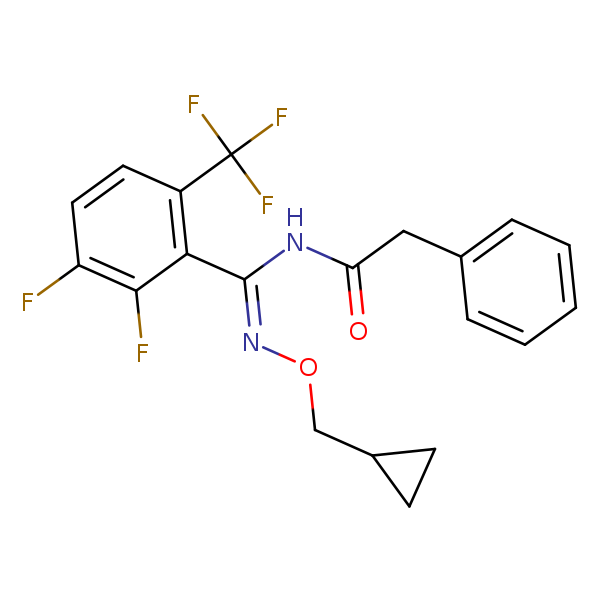 Cyflufenamid |
Similarity: 0.58 Measured: 1.27 Predicted: 2.15 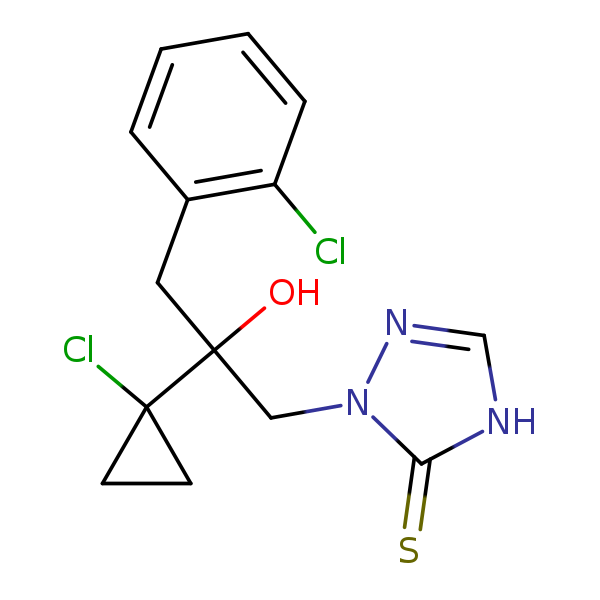 Prothioconazole |
Similarity: 0.52 Measured: 3.48 Predicted: 2.76 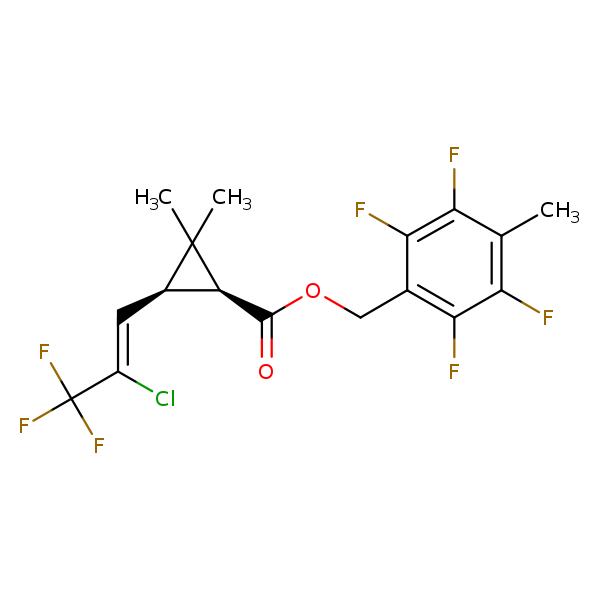 Tefluthrin |
Similarity: 0.50 Measured: 3.16 Predicted: 2.09 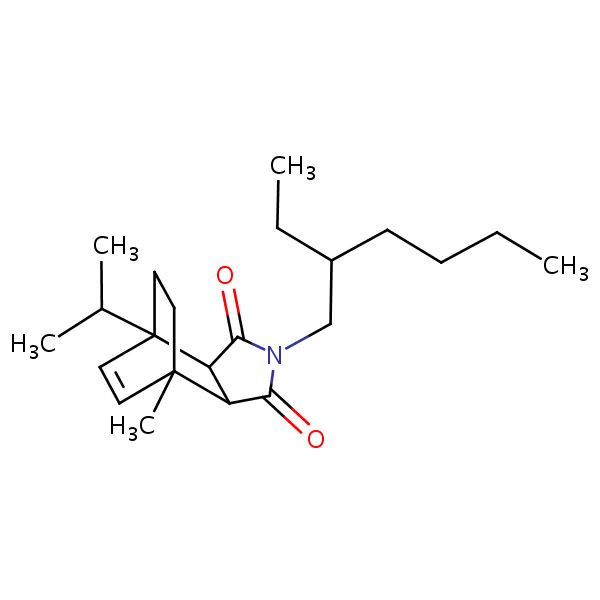 N-(2-Ethylhexyl)-1-isopropyl-4-methylbic... |