 |
|
|
|
| Model Performance | ||||||||||||||||||||||||
|
|
||||||||||||||||||||||||
|
||||||||||||||||||||||||
| Nearest Neighbors from Test Set |
 |
|
|
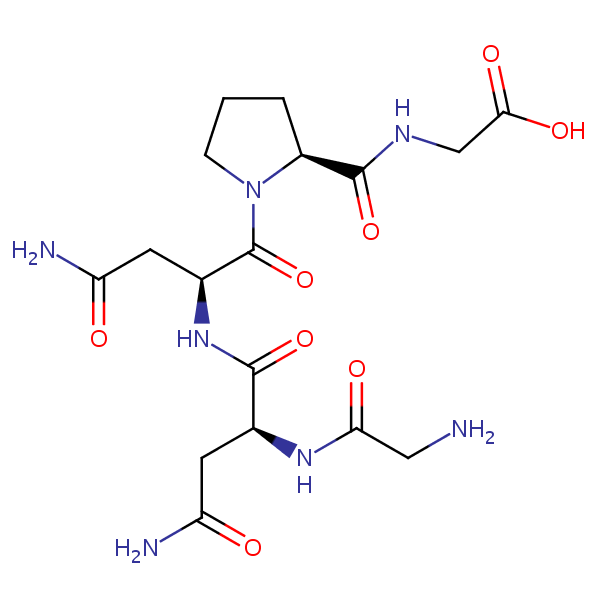
| Test chemical Measured: N/A Predicted: -8.84 Glycyl-L-asparaginyl-L-asparaginyl-L-pro... |
Similarity: 0.57 Measured: -6.10 Predicted: -3.74 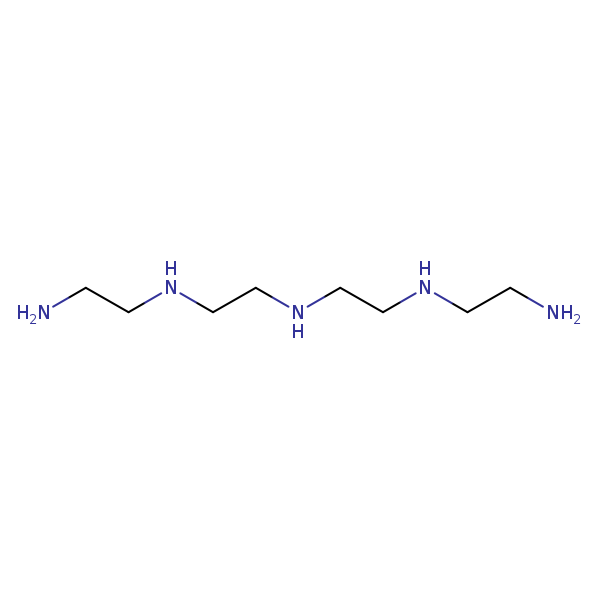 Tetraethylenepentamine |
Similarity: 0.52 Measured: -4.75 Predicted: -7.51 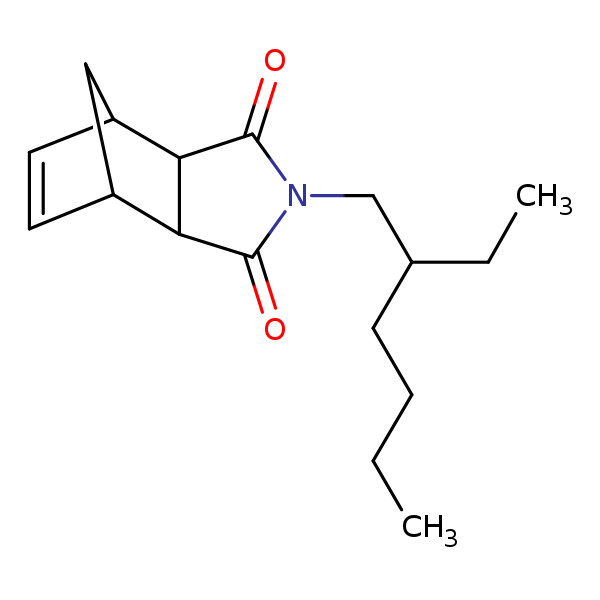 Octylbicycloheptenedicarboximide |
| Nearest Neighbors from Training Set |
 |
|
|
| Test chemical Measured: N/A Predicted: -8.84 Glycyl-L-asparaginyl-L-asparaginyl-L-pro... |
Similarity: 0.55 Measured: -8.43 Predicted: -9.11 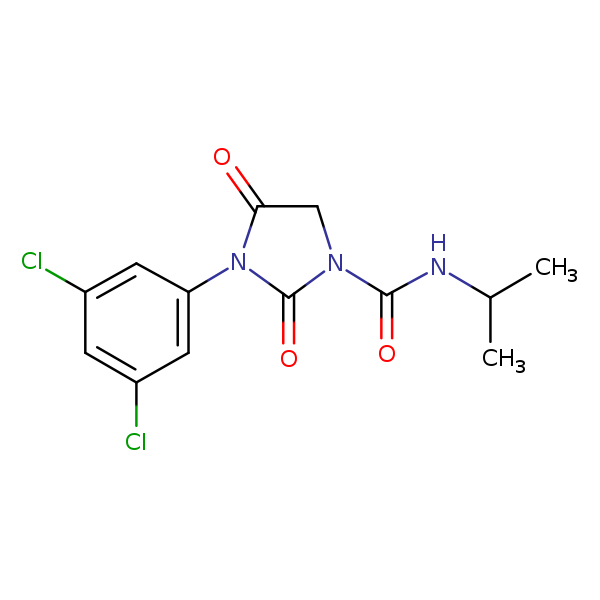 Iprodione |
Similarity: 0.52 Measured: -6.82 Predicted: -8.40 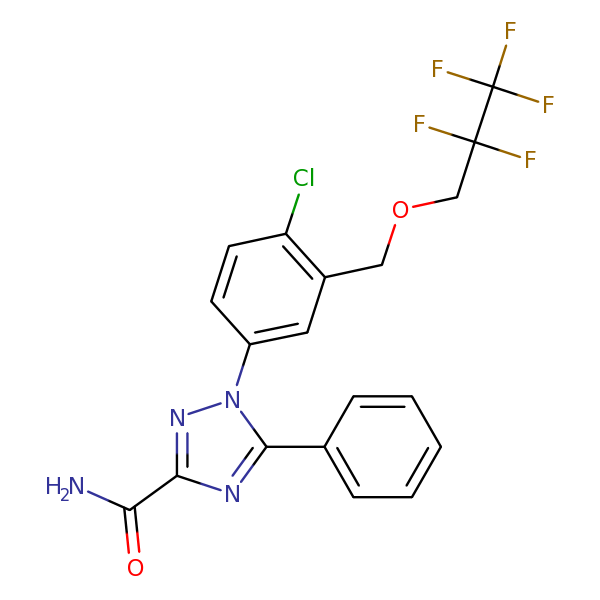 Flupoxam |
Similarity: 0.51 Measured: -8.82 Predicted: -8.37 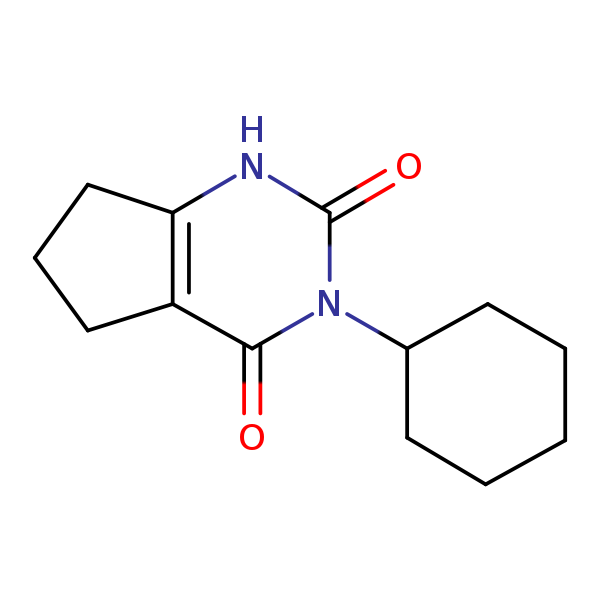 Lenacil |
Similarity: 0.51 Measured: -7.01 Predicted: -6.93 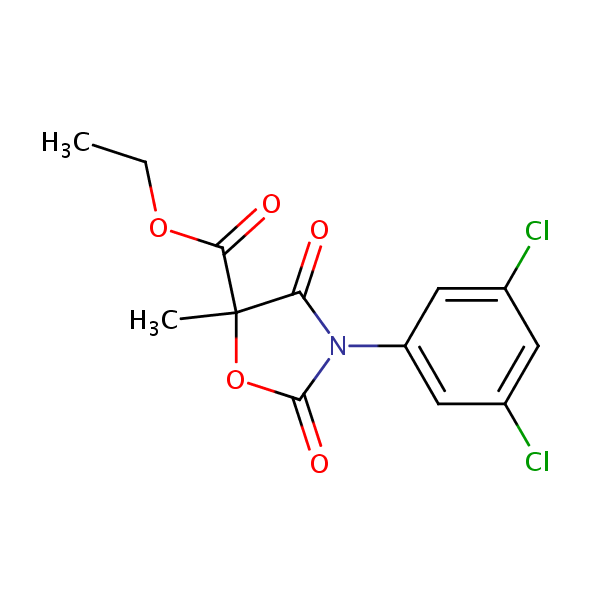 Chlozolinate |