 |
|
|
|
| Model Performance | ||||||||||||||||||||||||
|
|
||||||||||||||||||||||||
|
||||||||||||||||||||||||
| Nearest Neighbors from Test Set |
 |
|
|
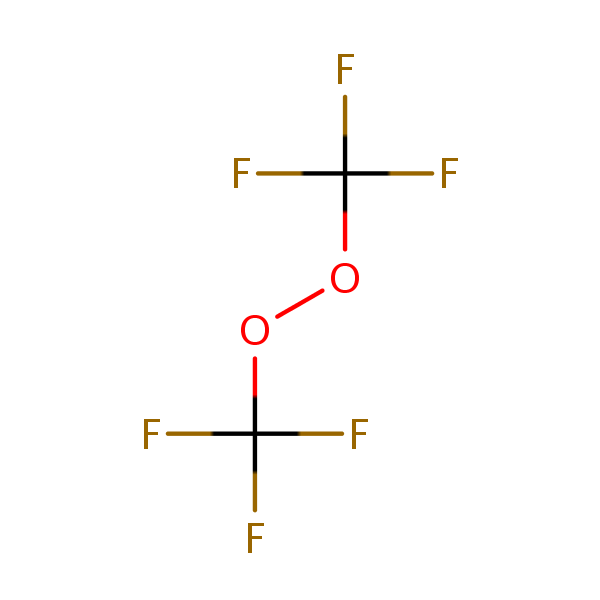
| Test chemical Measured: N/A Predicted: 1.30 Bis(trifluoromethyl) peroxide |
Similarity: 0.66 Measured: 1.90 Predicted: 1.42 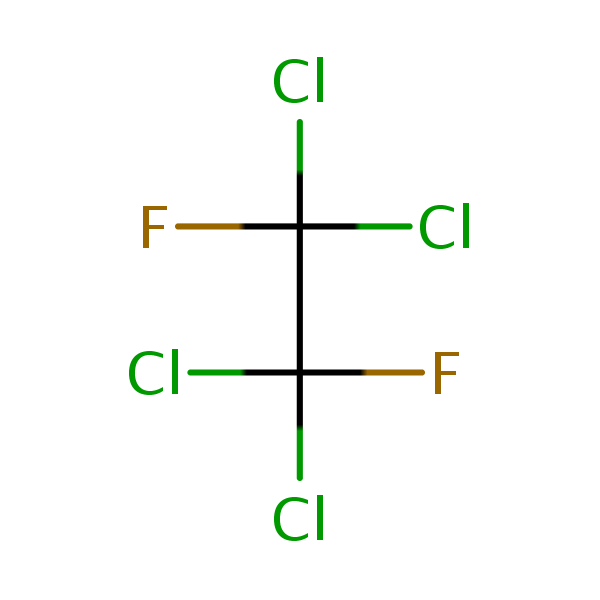 1,2-Difluoro-1,1,2,2-tetrachloroethane |
Similarity: 0.62 Measured: 1.03 Predicted: 1.24  Carbon tetrachloride |
Similarity: 0.60 Measured: 0.799 Predicted: 0.827 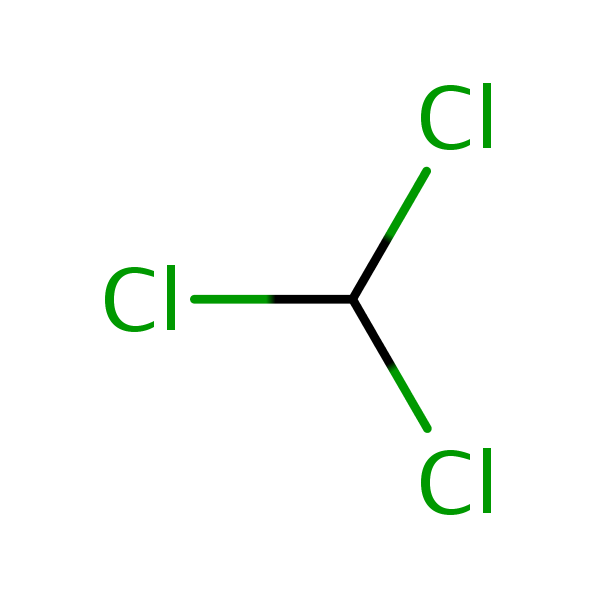 Chloroform |
Similarity: 0.56 Measured: 1.03 Predicted: 1.19 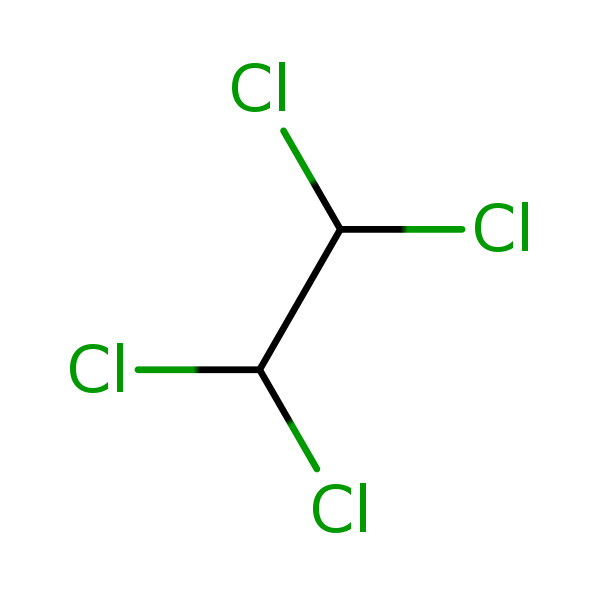 1,1,2,2-Tetrachloroethane |
Similarity: 0.54 Measured: 0.880 Predicted: 1.07  1,1-Dichloroethylene |
| Similarity: 0.53 Measured: 1.22 Predicted: 0.743  Bromoform |
| Nearest Neighbors from Training Set |
 |
|
|
| Test chemical Measured: N/A Predicted: 1.30 Bis(trifluoromethyl) peroxide |
Similarity: 0.75 Measured: 0.244 Predicted: 0.190  2H-Perfluoro-2-propanol |
Similarity: 0.69 Measured: 0.877 Predicted: 0.923  Dichlorodifluoromethane |
Similarity: 0.68 Measured: 1.62 Predicted: 1.16 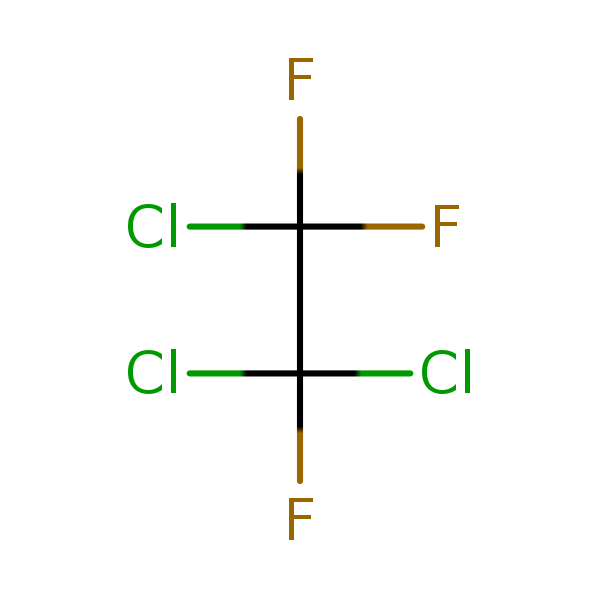 1,1,2-Trichloro-1,2,2-trifluoroethane |
Similarity: 0.58 Measured: 0.475 Predicted: 1.34 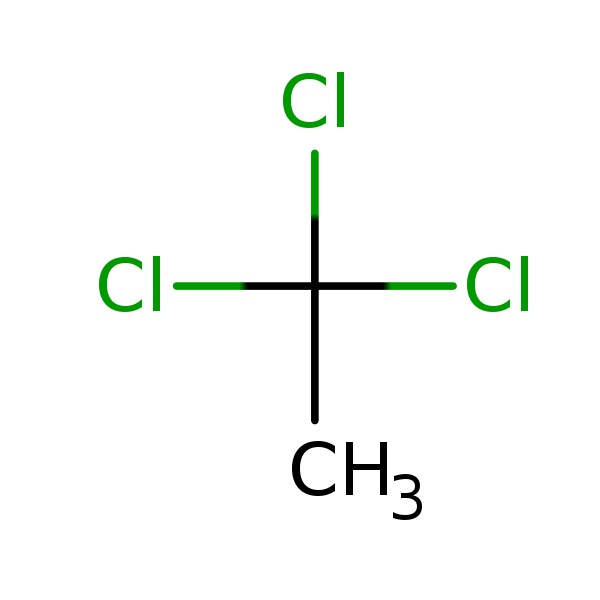 1,1,1-Trichloroethane |
Similarity: 0.57 Measured: 1.84 Predicted: 1.39 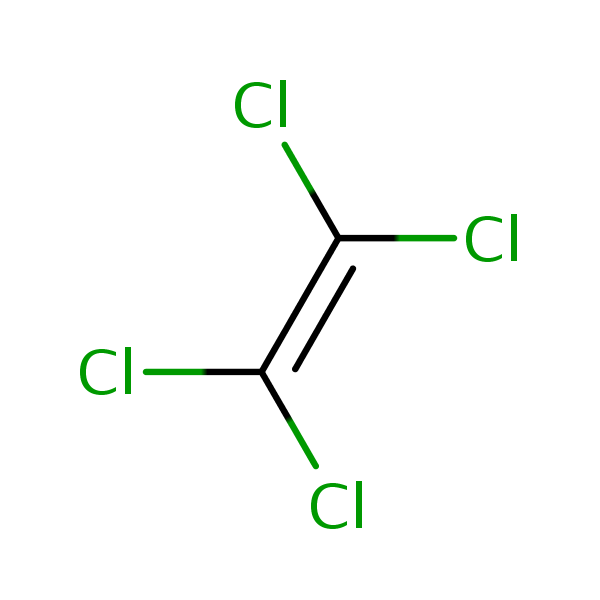 Tetrachloroethylene |
| Similarity: 0.57 Measured: 1.07 Predicted: 0.710 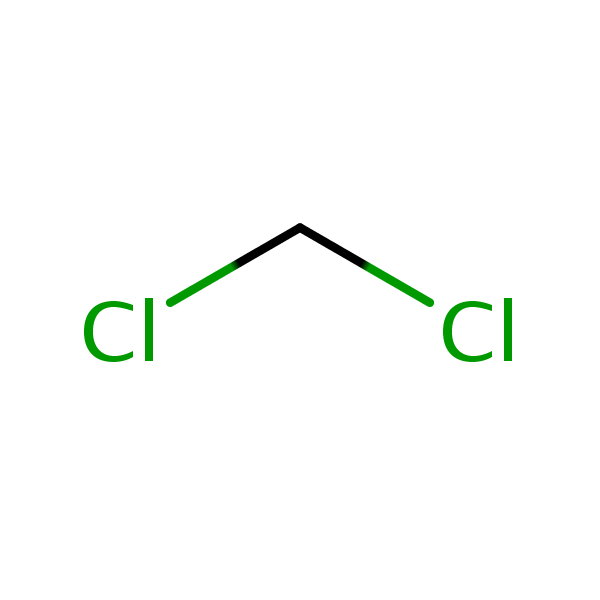 Dichloromethane |
Similarity: 0.56 Measured: 0.0250 Predicted: 0.553  Trichloroacetic acid |
Similarity: 0.55 Measured: 0.533 Predicted: 1.09  1,1,2-Trichloroethane |
Similarity: 0.55 Measured: 2.11 Predicted: 1.95  Hexachloroethane |
Similarity: 0.55 Measured: 1.11 Predicted: 1.36  Trichloroethylene |