 |
|
|
|
| Model Performance | ||||||||||||||||||||||||
|
|
||||||||||||||||||||||||
|
||||||||||||||||||||||||
| Nearest Neighbors from Test Set |
 |
|
|
| Test chemical Measured: N/A Predicted: 1.92 d-Butoxamine |
Similarity: 0.62 Measured: 0.818 Predicted: N/A 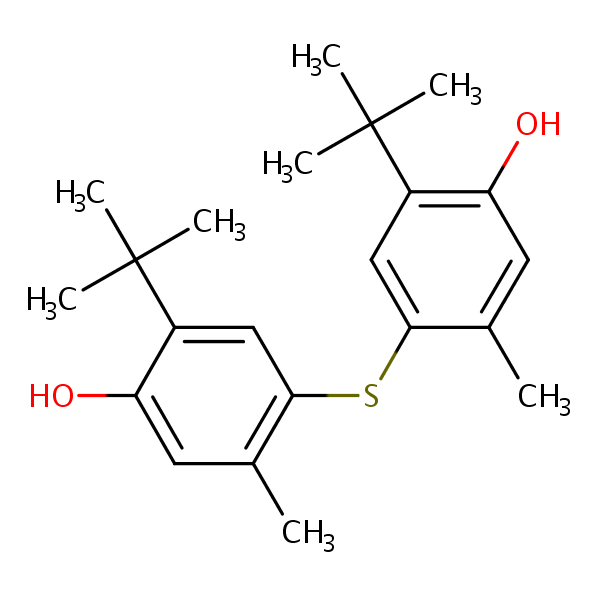 4,4'-Thiobis(6-tert-butyl-m-cresol) |
Similarity: 0.57 Measured: 2.20 Predicted: 2.84 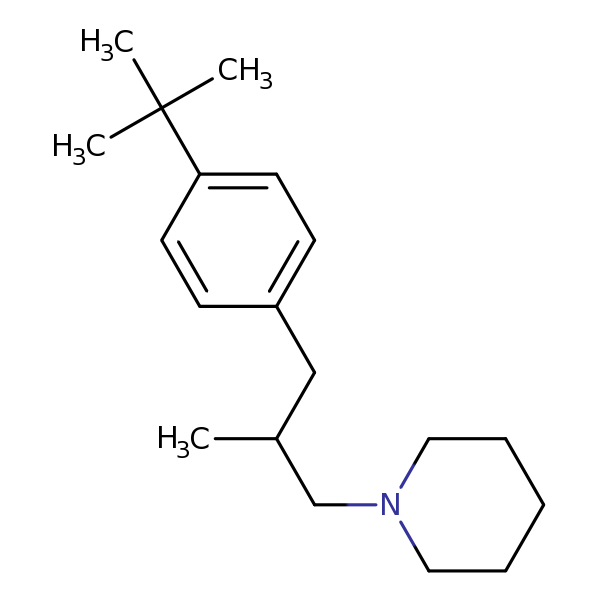 Fenpropidin |
Similarity: 0.55 Measured: 3.59 Predicted: 3.06 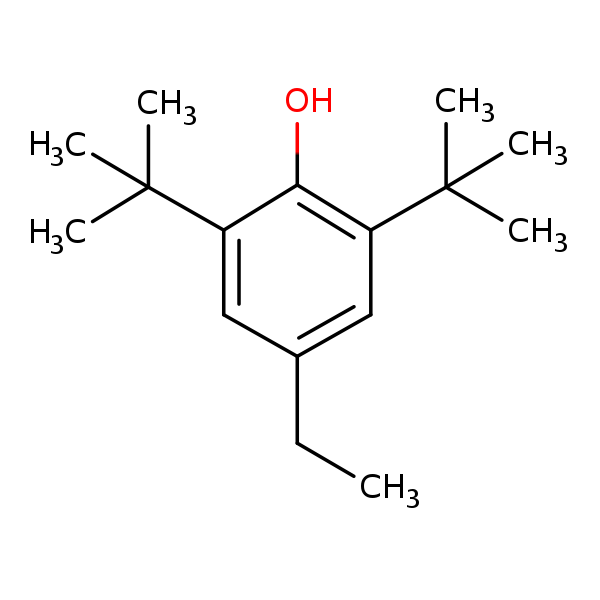 2,6-Di-tert-butyl-4-ethylphenol |
Similarity: 0.55 Measured: 3.14 Predicted: 2.13 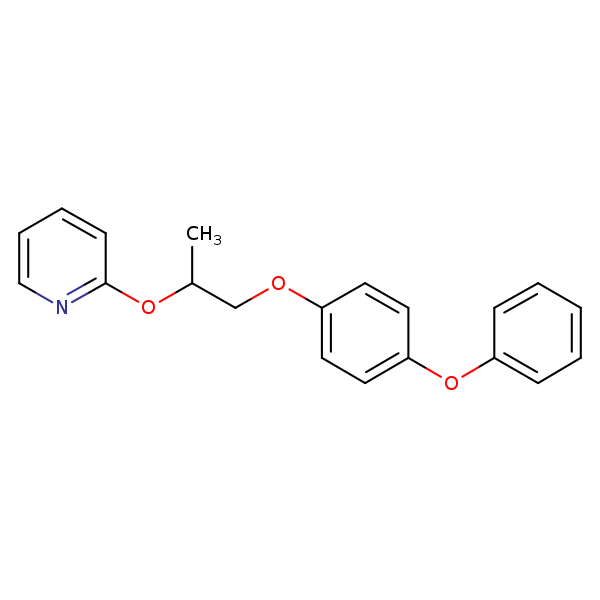 Pyriproxyfen |
Similarity: 0.50 Measured: -1.00 Predicted: 0.130 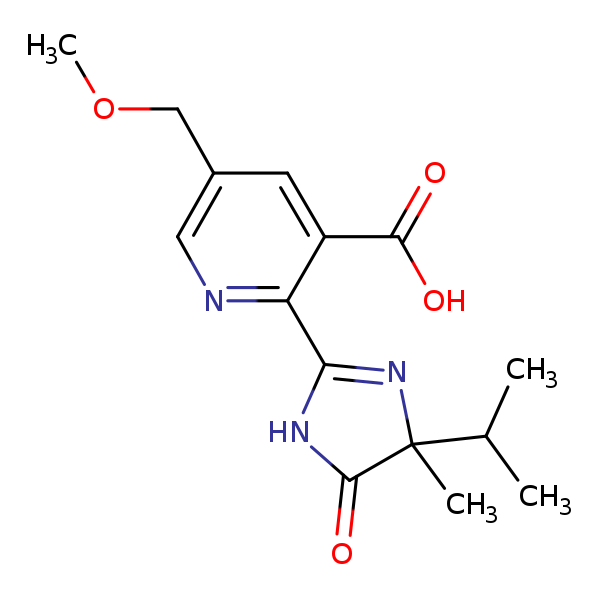 Imazamox |
| Nearest Neighbors from Training Set |
 |
|
|
| Test chemical Measured: N/A Predicted: 1.92 d-Butoxamine |
Similarity: 0.65 Measured: 2.60 Predicted: 3.09 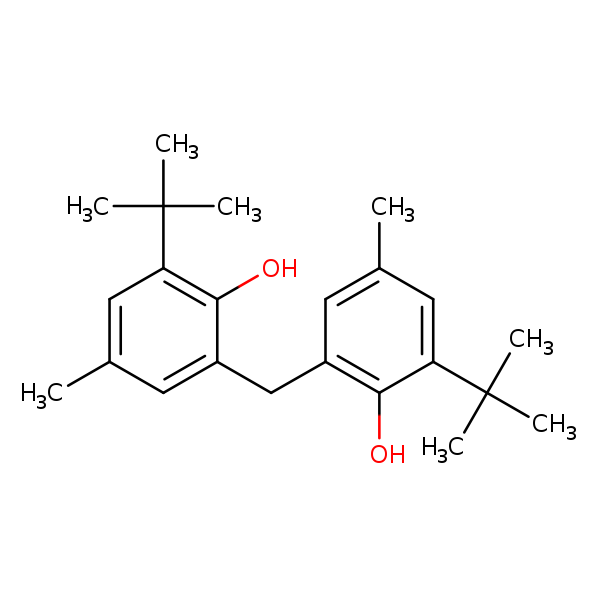 2,2'-Methylenebis(4-methyl-6-tert-butylp... |
Similarity: 0.64 Measured: 3.03 Predicted: 2.80 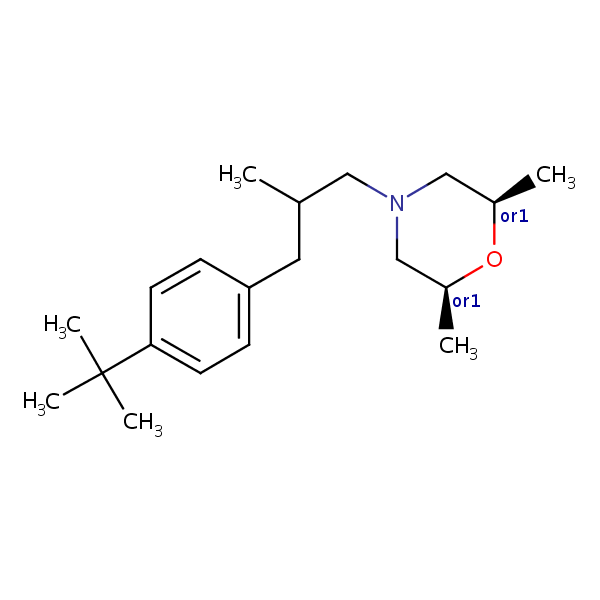 (2R,6S)-Fenpropimorph |
Similarity: 0.63 Measured: 3.98 Predicted: 3.45 ![Structural image of [1,1'-Biphenyl]-4-ol, 3,5-bis(1,1-dimeth...](https://comptox.epa.gov/dashboard-api/ccdapp1/chemical-files/image/by-dtxcid/DTXCID8037544) [1,1'-Biphenyl]-4-ol, 3,5-bis(1,1-dimeth... |
Similarity: 0.59 Measured: 0.351 Predicted: 1.66 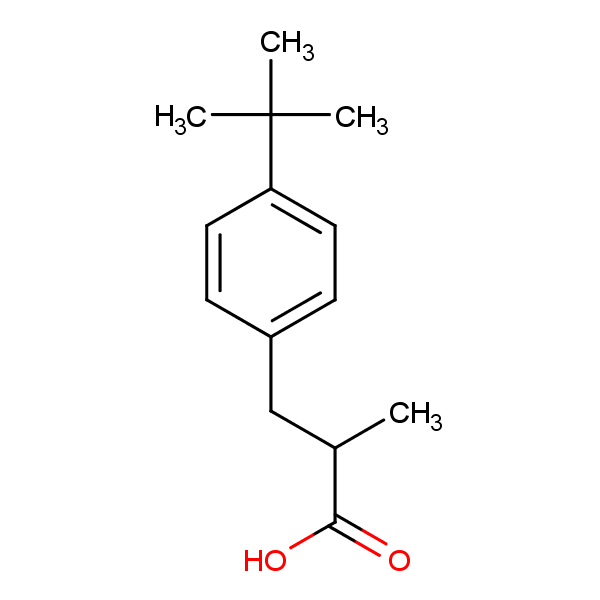 3-(4-tert-Butylphenyl)-2-methylpropanoic... |
Similarity: 0.59 Measured: 2.12 Predicted: 1.75 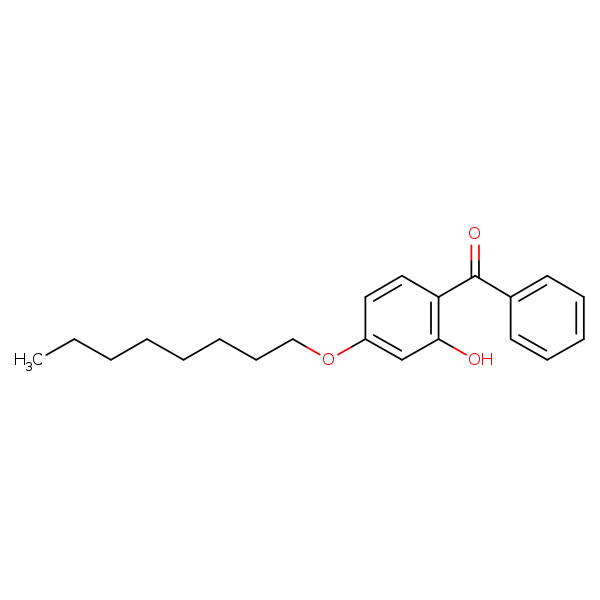 Octabenzone |
| Similarity: 0.57 Measured: 1.90 Predicted: 2.18 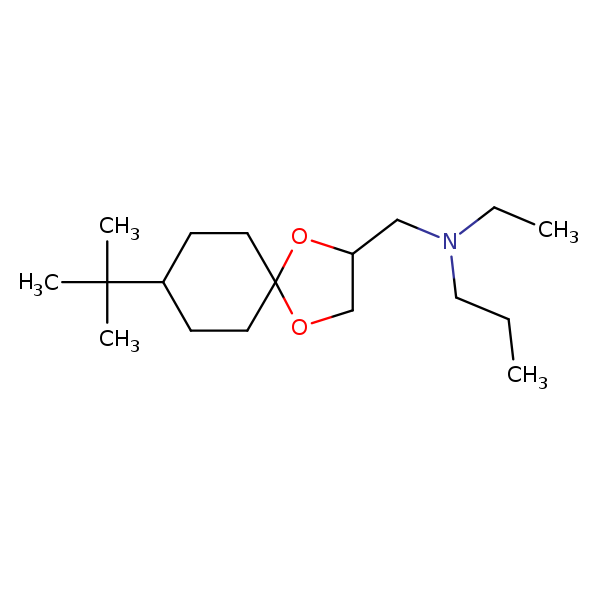 Spiroxamine |
Similarity: 0.57 Measured: 1.99 Predicted: 1.25 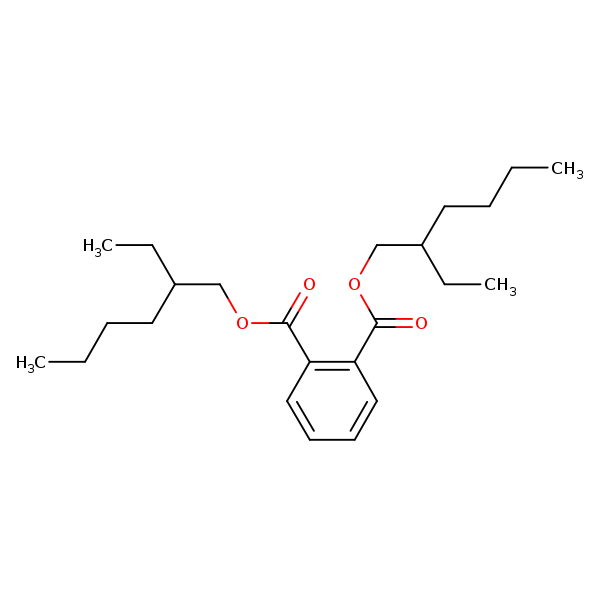 Di(2-ethylhexyl) phthalate |
Similarity: 0.56 Measured: 2.26 Predicted: 2.46 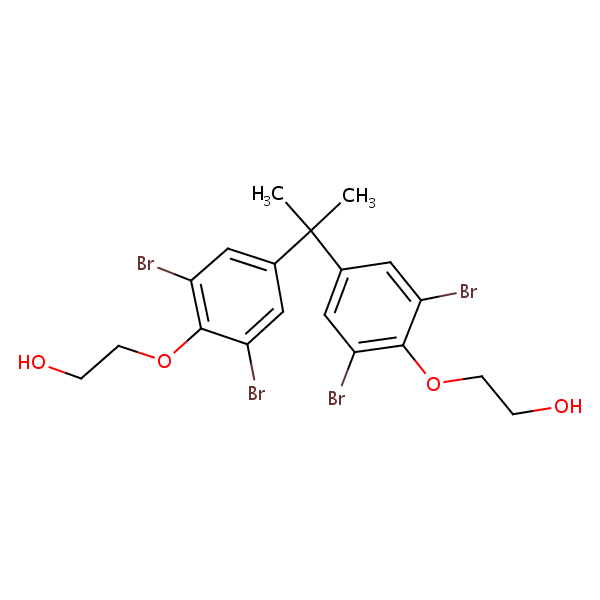 Tetrabromobisphenol A bis(2-hydroxyethyl... |
Similarity: 0.56 Measured: 1.89 Predicted: 1.98  Oxadiazon |
Similarity: 0.55 Measured: 0.489 Predicted: 1.09  4'-[2-(2,4-Di-tert-pentylphenoxy)butyram... |