 |
|
|
|
| Model Performance | ||||||||||||||||||||||||
|
|
||||||||||||||||||||||||
|
||||||||||||||||||||||||
| Nearest Neighbors from Test Set |
 |
|
|
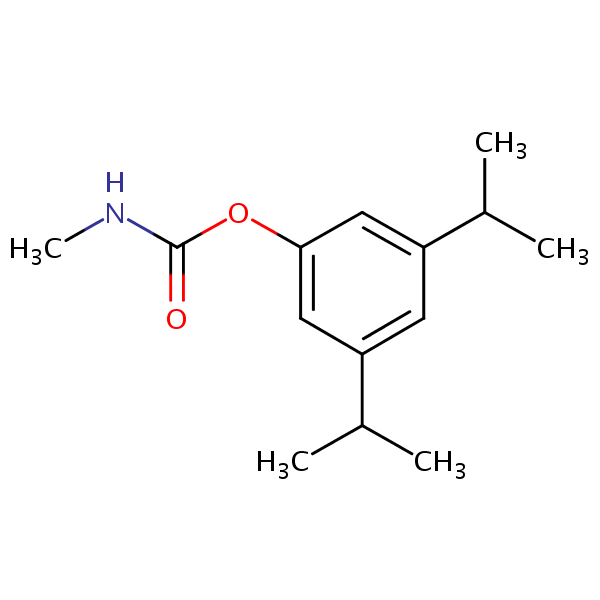
| Test chemical Measured: N/A Predicted: 1.19 3,5-Diisopropylphenyl methylcarbamate |
Similarity: 0.77 Measured: 0.682 Predicted: 0.685 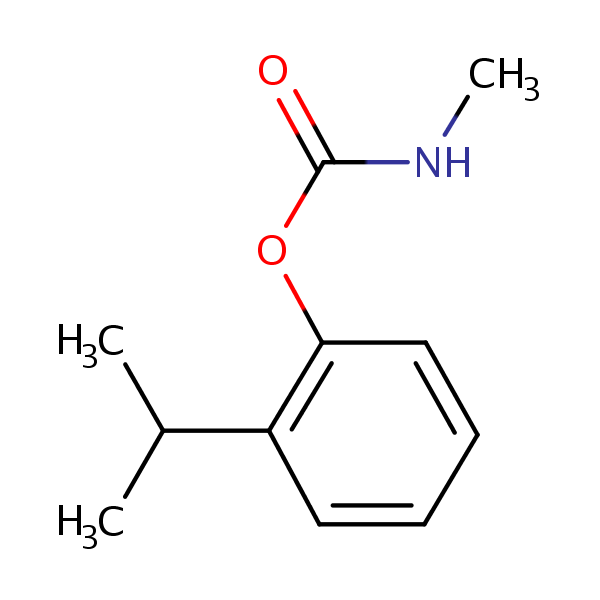 Isoprocarb |
| Nearest Neighbors from Training Set |
 |
|
|
| Test chemical Measured: N/A Predicted: 1.19 3,5-Diisopropylphenyl methylcarbamate |
Similarity: 0.89 Measured: 0.458 Predicted: 0.845 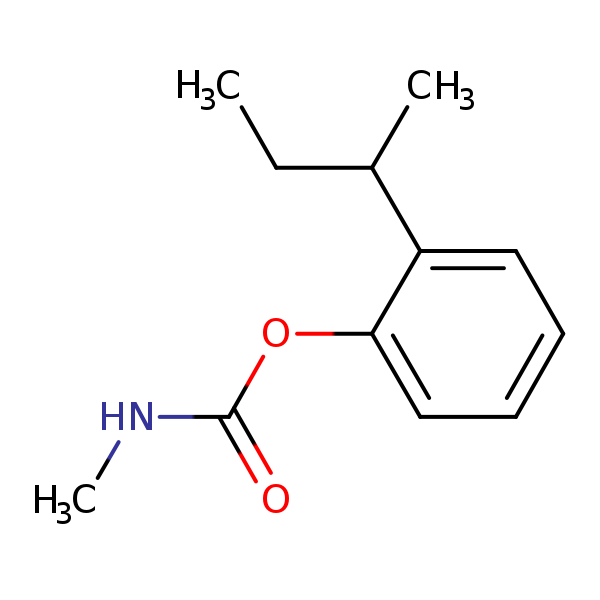 Fenobucarb |
Similarity: 0.60 Measured: 0.00 Predicted: 0.550 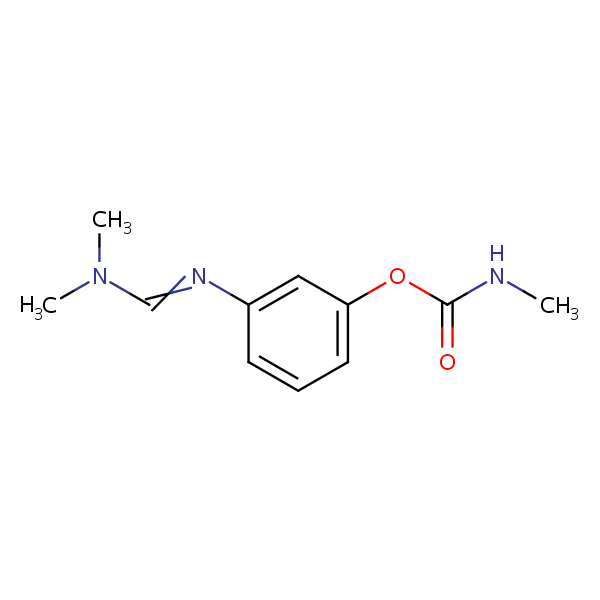 Formetanate |
Similarity: 0.59 Measured: 2.55 Predicted: 2.19 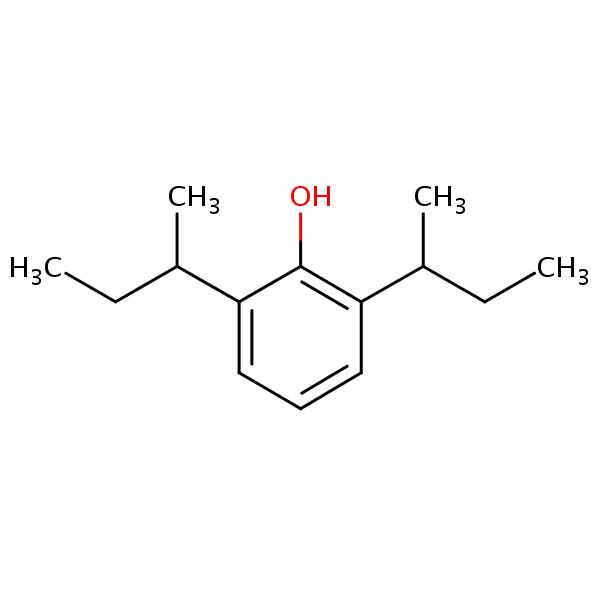 2,6-Di(butan-2-yl)phenol |
Similarity: 0.58 Measured: 0.298 Predicted: 0.700 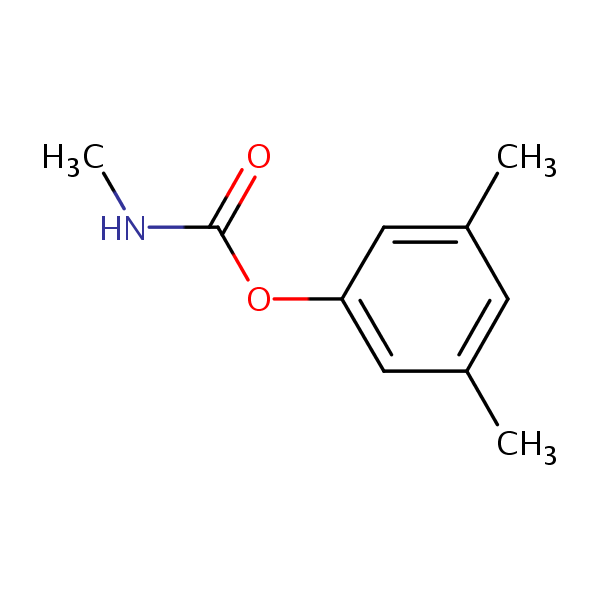 XMC |
Similarity: 0.55 Measured: 1.43 Predicted: 0.680 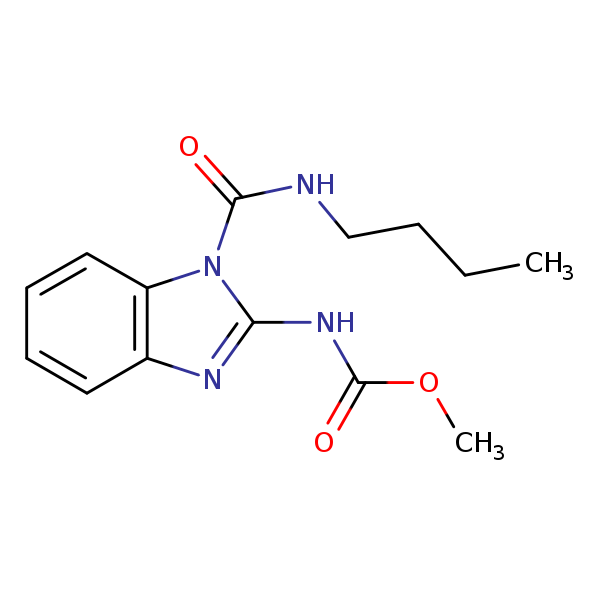 Benomyl |
| Similarity: 0.54 Measured: 1.89 Predicted: 1.98 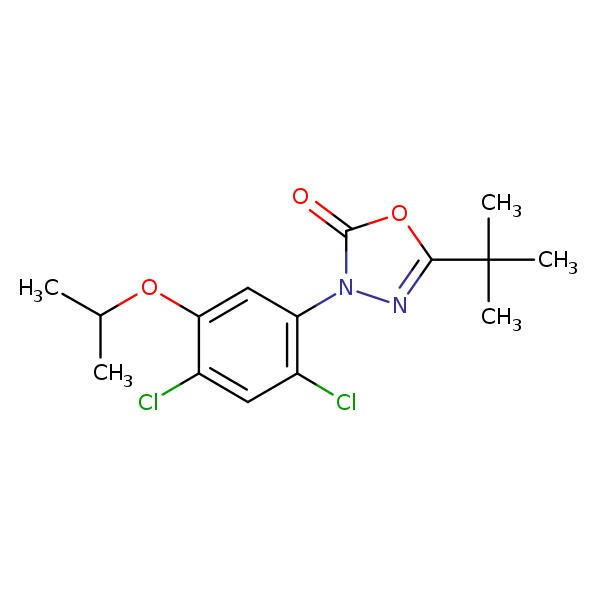 Oxadiazon |